A BIG WINDOW
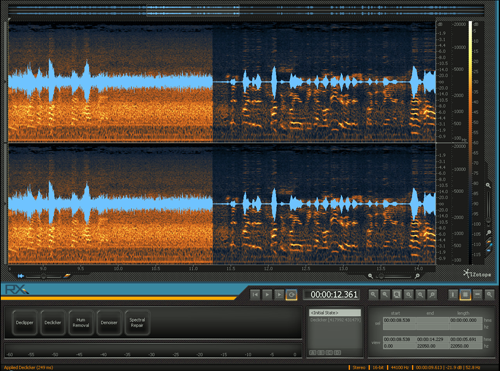
RX’s interface is dominated by a large graphic display that is a combination waveform and spectrogram, and which extends almost across the entire window. The display includes a full-length waveform overview for navigation, although oddly you cannot select a range directly from the overview; however, once you’ve selected a range from the main display you can then grab and move that selection in the overview. At the rightmost edge is a spectrum range scale that shows you the spectrum frequency range and to what level each of the spectrum colors correspond. A slider lets you zoom either the spectrum or the waveform horizontally, and the labels independently scale themselves to suit the zoom level.
Below the display on the right is a standard horizontal zoom slider, while on the left there is a slider that controls the opacity of the waveform and the spectrograph — full left shows you all waveform, while full right displays only the spectrum information. Wherever you’re comfortable setting that slider, it’s really nice to be able to see both, and I cannot think of another program that does this.
The individual functions of RX are on dedicated buttons in the lower right, and below these is a horizontal stereo meter. The lower right is home to the transport controls and counter, a collection of zoom and selection tools, an Undo panel that shows you a selectable list of edits you’ve made so you can step backward or forward, along with a table of values for what’s selected and what you’re viewing at the moment.
The zoom and selection tools are comprehensive, and each has a key equivalent to speed up your workflow. You can zoom or select just the audio waveform, just the spectral info, or both. You can also zoom to either edge of the current selection with just a click or a key combo. It was a bit to get my head around at first, but by the time I’d completed my first project I had a good handle on it.
Each of the function buttons brings up a window with the various parameters for that function. Most are very intuitive, and I didn’t really need the documentation. The docs are built into the program, and clicking on a question mark button on any window will bring up the help files in your browser. They’re sparse, but there’s enough there to do the job. In addition, you can perform cut, copy, paste, and delete from within RX, and the paste can insert, replace, or mix your selection, whether it’s audio or spectrum.
From an appearance standpoint, RX’s interface is striking. The program is all done in shades of gray on a charcoal background. The default settings display the audio waveform in light blue and the spectrograph running from cyan to orange against increasing intensity. You can choose other color schemes that are far more garish and make it easier to see frequency intensity, but these also obscure the waveform. While the overall look is impressive, the light gray on dark gray text makes for tough going when reading labels.
