by Steve Cunningham
Everyone knows Google, and if you have a website as part of your business and marketing strategy, then you’ve probably at least heard of Google Analytics. You may even have gone diving into the various charts and graphs that are part of Analytics. But for most of us, Google Analytics is a geeky black hole of data, more appropriate for a text-slinging Terminal jockey than for a radio pro. But there is web magic in there, and the ability to extract a great deal of information that will tell you what benefits you’re currently getting from your website, and how to crank up the juice.
Google Analytics can track activity on a web site, individual web page, or on an app. Now, it is the case that a significant segment of RAP readers do not have a dedicated website of their own; many are using Facebook as their primary point of contact with their customers and potential customers. While Facebook features “Insights” for Facebook Pages (not for individual’s home pages), at this point getting detailed information Facebook about visitors and what they do on a Page requires the use of (mostly) paid third-party apps and services. (Note: we’ll provide a roundup of Facebook analytic apps and services in a future issue.) Voice actors may be using voicebank.net, voices.com, or voice123.com, but every one of those allows a link to the actor’s personal site, which of course can be tracked.
GETTING HOOKED IN
For purposes of this basic overview we will assume that you have a regular standalone website, and that you or your webmaster (or webmistress, or web designer, or whatever) has already connected your site to Google Analytics (hereafter GA). If you have a site and it has not been connected, then you are flying blind!
All that’s needed are 1) a Google Analytics account, which can be set up using a regular Gmail account, at www.google.com/analytics, and 2) a bit of code added to the header or footer of your website. It is rarely difficult, and should you have to pay someone to do the work, it is well worth the little it should cost. Make sure that your browser is not blocking Javascript, since that is the engine that powers GA. By the way, as the website owner, you should have access to your GA account and information. If you are in a situation where your web person is the only one who has access to your GA data, then it may be time for you to hire a new web person.
There’s a wealth of tools for tracking visitors, settings goals, and measuring them, all at no cost to you once your site is connected; you just need to know what to look for and where to find it. Once you’re connected, you can go to www.google.com/analytics, sign in and access your site.
LET’S GO EXPLORING
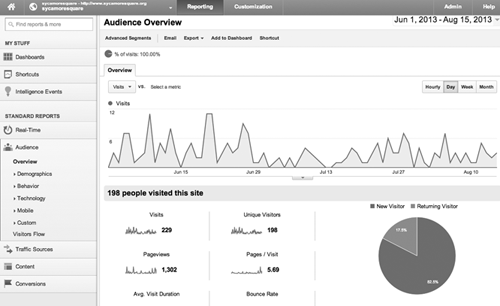
The first screen you’ll see when you log in is a 10,000 foot level view of your site’s traffic, and the first thing you should do is set the date range to see a reasonable time frame’s worth of data. Unless you’re getting several thousand hits every month -- unlikely for a VO or production person’s site -- a month or two will be a better choice. (Note: the site shown here is a local neighborhood site, with relatively low traffic mostly from local visitors, but it illustrates the point.)
Note that the tab across the orange menu bar at the top has now switched to Reporting. Meanwhile the menu bar down the left side is where the interesting stuff lies. Basically, GA can show you most any of the data it has in any way you want to see it. All of the visible panes are moveable, and can be removed and replaced with other panes. This is beauty of the GA Dashboard. Clicking on the Dashboard menu will reveal a Private item, clicking that shows the My Dashboard item, which is the default.
Below that is a New Dashboard item, which when clicked, brings up a template from which you can begin building a new Dashboard, populating it with any of the various widgets. Choose the metric you’d like to see, and the format in which you’d like it displayed. Experiment with the Dashboard, and don’t worry about messing it up -- if it all goes sideways on you, you can always create a new Dashboard using the fully populated template on the right, which will give you a duplicate of the original My Dashboard.
The next interesting place to explore is the left-hand menus under Standard Reports. Here you’ll find some real meat on the bone to work with. Click down through Audience and you’ll find Demographics; whether your visitors are new or returning, what technology they used to visit, and much more. Don’t fail to click on the individual display titles to get more information on a specific metric. Even more interesting are the left-hand submenus under Traffic, and especially Content and Conversions. If you find you’re getting lost in the jargon (conversions, bounce, landing pages, etc.), just look for the little tool-tips on nearly every measurement (the circle with a question mark in it). These will bring up a small box of text that clearly defines what the specific metric measures.
Among other things, the Content menus show you how well your site performs in terms of speed, and how long people stay on the site or on an individual page. You’ll see Bounce, which is an important measurement of your site’s “stickiness” -- that is, what percentage of visitors to a page left without clicking an item on the page or another page menu. In other words, they “bounced” off your site from that page.
Conversions is perhaps the most important measurement, because it tells you how many visitors did what you wanted them to do on your site. You do know what the one thing is that you want them to do, don’t you? You can set a specific, useful, and measurable goal that will help you judge how well your website is serving you, and if it isn’t, what you might do to get it to serve you. And while exploring this page is fun (at least for a while), it’s time to get down to work. Let’s try setting up some goals.
NOW GET TO WORK
– Tracking Visitor Engagement
“Are my users engaged with my site?” This is probably the single most important question you can ask. Google Analytics will not magically tell you that “Your visitors love your site because they are very engaged in it,” nope. To determine whether your visitors are engaged, you can track how long they stay on your site, or even on a given page. The longer they stay, the more engaged they are with your content, and the more likely they are to do what you want them to do, like listen to your demos, or buy your tee-shirts with the snarky slogans on them.
To set this Goal, click the Goals menu under Conversions. At the top you’ll see a brief explanation of what you’re about to do, so click the Set Up Goals button (you may have to scroll to the top of the page to see it). Click the Create a Goal button, and type in the name of your goal, something like “Visitor Engagement”. The template should be Custom, since the others don’t do what we need done, and clicking Next Step lets us fill in the Description as “Visit Duration” and click the Duration radio button. Then on “Goal Details”, set the condition to greater than three minutes. Google Analytics will then do its thing and you can visit your results in the Goals Overview page. Whatever the result may be, you can and must continue to improve on it. Stay in the Profile section for the next move.
– Enable Site Search Tracking
“What are my visitors looking for?” Site search is very important in tracking keywords. “Keywords” is just a fancy way of labeling the words that people type in the Google or Bing search box. They’re important because the keywords your visitors use tell you exactly what visitors are looking for on your site. Remember, Google Analytics helps you in your never-ending process of learning about your target market’s needs and wants, which is why we must take in all the information that we can.
While you’re still in the Goals section, enable site search tracking. Click the “Profile Settings” box, and look toward the bottom of the options. On the Site Search option, select “Do Track Site Search”. To view your data results, go back to the main “Reporting” tab in the orange bar at the top, click on the Content menu on the left and lastly “Site Search”. Found it? Cool, you’re starting to get a handle on it!
– Check Site Speed
This one is fairly obvious, since the menu already exists for it. Site speed is often an overlooked element in SEO (Search Engine Optimization). If you are not convinced that site speed is important, you should know that Google considers your site’s overall speed when ranking your pages. More importantly, site speed is crucial for the overall user experience. If your site is loading slowly, you can expect visitors to just bounce out. To track site speed with Google Analytics, go to “View Reports”, then “Content”, and click on “Site Speed”.
If there is a high bounce rate in pages that take a longer time to load, then you will need to “optimize” these pages; make graphics smaller and more simple, or just yell at your webmaster. He or she will get it, and if they don’t, then perhaps it’s time to find another... well, you know. Site Speed gives you very useful data, because you can measure how load speed affects your conversion rates. You can also discover other useful data, such as on which browser is the fastest to load your site.
– Track Your Goals
Goals aren’t there to just look at. You’ll want to check your reports regularly to see if you are anywhere near your goals. If you are not, then use the data you have collected in Google Analytics to make improvements. A very useful feature in GA allows you to add annotations within the results displays to indicate which actions you have taken that most improved your results. You can do this by clicking on the down arrow under a visual graph, then click “Create New Annotation”.
THE WRAP
I know that this is a bit far afield for Radio And Production, but our business today is all about the web. It’s high time we learn how to evaluate our sites to make sure they’re doing what they’re supposed to on our behalf. Whether you are a DIY website owner, the client for some design agency, or The Boss riding herd over some unfortunate webmaster or webmistress, knowing a bit about Google Analytics can help you make better decisions, improve your web presence, and get your money’s worth.
And should you find yourself hopelessly lost and/or frustrated, never fear. Google has a wealth of learning resources that probably explains this stuff better than I have here. It’s a reference I use regularly, and it can be found at support.google.com/analytics.
Go ahead, geek out. You know you want to.
♦